简体中文
繁體中文
English
Pусский
日本語
ภาษาไทย
Tiếng Việt
Bahasa Indonesia
Español
हिन्दी
Filippiiniläinen
Français
Deutsch
Português
Türkçe
한국어
العربية
Gold Faces Strong Resistance at $3450 – Bulls Fail in Four Consecutive Attempts
Sommario:From a technical standpoint, gold has tested the $3450/oz resistance level four times on the daily chart without a decisive breakthrough. This has effectively established $3450 as a psychological ceil
From a technical standpoint, gold has tested the $3450/oz resistance level four times on the daily chart without a decisive breakthrough. This has effectively established $3450 as a psychological ceiling for bullish momentum.
")
(Chart 1: Gold Daily Candlestick Chart; Source: MT4)
Rumors are circulating that the U.S. and EU are close to finalizing a tariff deal, potentially reducing tariffs from 30% to 15%. However, we remain skeptical that this is the primary reason for gold's recent pullback. After all, a similar agreement between the U.S. and Japan reached the previous day failed to derail gold's uptrend, which instead continued to post new highs.
We believe the real driver lies in tonight‘s upcoming ECB policy meeting. As the world’s second-largest economic bloc, the ECB is expected to issue forward guidance on inflation and economic growth, which could significantly influence the trajectory of global asset prices, including commodities.
Another key development to watch is the Japanese yen. The yen has re-entered an appreciation phase, and we anticipate this trend will persist into Q4 this year. Besides the U.S. dollar, the yen remains one of the most liquid and favored safe havens for capital inflows, especially during periods of emerging market outflows. Historical patterns have shown that in risk-off environments, capital tends to rotate into the dollar and yen for protection.
")
(Chart 2: Capital Flowing Into Safe-Haven Currencies; Source: MT4)
Looking at currency pairs, we see a high probability of both the yen and the dollar strengthening simultaneously in the coming quarter, for the following reasons:
The U.S. and Japan have reached a new trade agreement, which may usher in a growth phase for Japan‘s economy. This positions Japan to absorb some of the export market share that China previously held, particularly in manufacturing. In turn, this growth could bring upward pressure on inflation and provide the Bank of Japan with both the justification and tools for tightening its monetary policy.
Markets increasingly believe that the average U.S. universal tariff rate will settle around 15%. If we apply this to the 2024 U.S. import figure of $3.36 trillion, a 15% tariff could generate roughly $500 billion in revenue. The narrowing of both the trade and fiscal deficits would bolster the dollar's strength.
Support: 3379 / 3360 / 3342
Resistance: 3438
The dollar’s appreciation may weigh heavily on non-dollar currencies, including the euro. According to the latest FMS data, eurozone assets are currently over-allocated by more than two standard deviations above their historical average, while U.S. dollar assets are under-allocated by one standard deviation. This suggests significant room for a catch-up rally in U.S. assets and the dollar.
While macroeconomic data is often criticized for being a rear-view mirror analysis, historical data remains a valuable tool for forecasting future trends. In the current environment, investors are receiving increasingly clear signals on asset directionality.
Technical Analysis on Gold
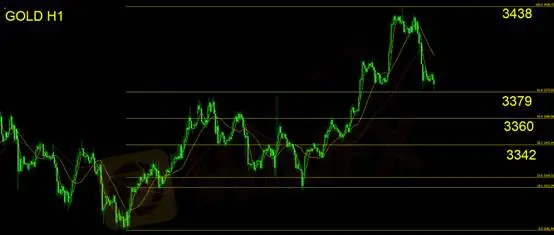
Gold has failed to break above the $3450 resistance level on four separate occasions, reinforcing it as a firm ceiling for bearish pressure. The daily chart now shows a bearish engulfing pattern, indicating a potential reversal. Traders following disciplined strategies may consider initiating small short positions, with stop-loss levels set above $3400.
Key Fibonacci support levels are found at:
If these support levels break consecutively, short positions can be scaled in near each resistance level, aiming to capture a potential correction from previous highs.
Risk Disclaimer: The views, analysis, research, prices, or other information mentioned herein are provided as general market commentary and do not constitute investment advice. Readers assume all risk associated with the use of this information. Please trade responsibly.
Disclaimer:
Le opinioni di questo articolo rappresentano solo le opinioni personali dell’autore e non costituiscono consulenza in materia di investimenti per questa piattaforma. La piattaforma non garantisce l’accuratezza, la completezza e la tempestività delle informazioni relative all’articolo, né è responsabile delle perdite causate dall’uso o dall’affidamento delle informazioni relative all’articolo.
WikiFX Trader
GTCFX
FBS
Vantage
Exness
BG SAXO
TMGM
GTCFX
FBS
Vantage
Exness
BG SAXO
TMGM
WikiFX Trader
GTCFX
FBS
Vantage
Exness
BG SAXO
TMGM
GTCFX
FBS
Vantage
Exness
BG SAXO
TMGM
Rate Calc

