简体中文
繁體中文
English
Pусский
日本語
ภาษาไทย
Tiếng Việt
Bahasa Indonesia
Español
हिन्दी
Filippiiniläinen
Français
Deutsch
Português
Türkçe
한국어
العربية
Gold Breaks Above $3400 as Stocks Hit New Highs Again
Lời nói đầu:Over the past two weeks, both safe-haven and risk assets have been rallying simultaneously—a pattern that has become the new market norm since 2020, diverging significantly from the logic of the previ
Over the past two weeks, both safe-haven and risk assets have been rallying simultaneously—a pattern that has become the new market norm since 2020, diverging significantly from the logic of the previous decade. More importantly, we‘ve identified a key observation: yesterday's rally in gold was aligned with the movement of non-dollar currencies, suggesting the U.S. Dollar Index (DXY) still plays a vital role in forecasting gold’s future direction.
Yesterday, the DXY slid from 98.21 to a low of 97.78. EUR/USD broke above the 1.17 threshold, while USD/JPY dropped below 148. When decoupling the trends of risk assets, non-dollar currencies, and gold, we see that the recent U.S. equity rally is largely driven by a FOMO rebound. This aligns with the latest FMS Fund Manager Survey, which shows a strong shift in portfolio allocations toward U.S. assets. Combined with robust Q2 earnings reports, fund managers currently see no compelling reason to sell U.S. equities.
In a relatively calm trading session, the dollar experienced a significant technical pullback. We interpret this as a technical correction and view the DXY as bottoming out rather than entering a prolonged bearish trend.
Turning to commodities, crude oil prices have been declining gradually. We believe the market will soon begin circulating concerns about weakening end-user demand and potential recession risks. This aligns with our view that the seasonal summer demand boost for oil has failed to materialize. Meanwhile, OPEC+ is expected to increase production, with Bloomberg reporting a planned final phase of output expansion—an additional 550,000 barrels per day—by September.
According to the International Energy Agency (IEA), global oil inventories are currently rising at a rate of 1 million barrels per day, leading to an expected supply surplus of 1.5% in Q4 this year.
However, the UAE‘s Energy Minister noted during the Vienna meeting that despite months of production hikes, inventory levels haven’t significantly accumulated, indicating that the market genuinely requires the added supply.
From the Middle Easts perspective, production costs are only around $6 per barrel. Given that, we believe OPEC+ still has room for further production increases in October. Maintaining high oil prices may not necessarily be a strategic priority.
</b>")
(Chart 1: U.S. Crude Oil Futures Prices; Source: CNBC)
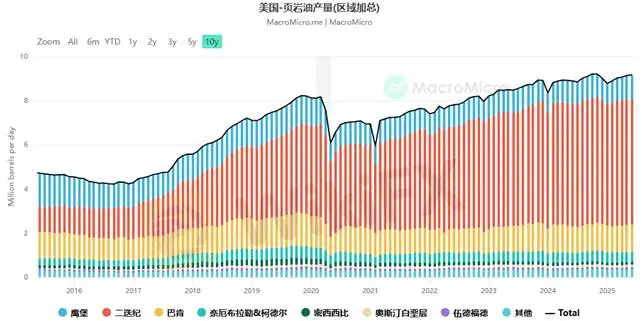
(Chart 2: U.S. Shale Oil Production Remains Elevated; Source: MacroMicro)
The pullback in commodity prices will likely exert downward pressure on inflation. If end-user demand does weaken in the second half of the year as expected, regardless of whether the Fed initiates rate cuts, capital could return to the U.S. dollar as a safe haven—just like in 2022. This would result in a broad-based asset decline, with only the dollar rallying.
Such disarray could persist for at least one quarter, or even longer. Our outlook remains unchanged—weve shifted from bearish to neutral on gold in the short term, while maintaining a more conservative mid-term stance. The key factor remains the direction of the dollar.
Gold Technical Analysis
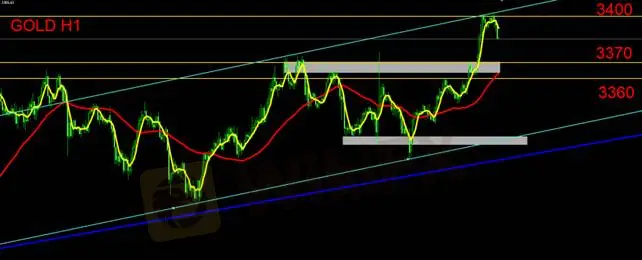
On the hourly chart, gold shows a two-leg upward movement forming an ascending channel. If we analyze price action using this channel structure, investors should be cautious now that gold has broken above $3400 and touched the upper boundary of the channel—suggesting a likely pullback. Initial support lies at 3370 and 3360. If these levels fail to hold, gold may retreat toward the lower channel boundary for further support.
Intraday Strategy:
If gold retests the 3404 region but fails to break higher, traders may consider short-term sell positions within the channel range. Between buying and shorting, we currently favor short trades as the market structure evolves.
Support Levels: 3370 / 3360
Resistance Level: 3400
Risk Disclaimer: The views, analysis, research, price levels, or other information provided herein are for general market commentary purposes only and do not represent the position of this platform. Readers are solely responsible for any trading decisions made based on this content. Trade with caution.
Miễn trừ trách nhiệm:
Các ý kiến trong bài viết này chỉ thể hiện quan điểm cá nhân của tác giả và không phải lời khuyên đầu tư. Thông tin trong bài viết mang tính tham khảo và không đảm bảo tính chính xác tuyệt đối. Nền tảng không chịu trách nhiệm cho bất kỳ quyết định đầu tư nào được đưa ra dựa trên nội dung này.
Sàn môi giới
AvaTrade
Exness
STARTRADER
IC Markets Global
FXCM
KVB
AvaTrade
Exness
STARTRADER
IC Markets Global
FXCM
KVB
Sàn môi giới
AvaTrade
Exness
STARTRADER
IC Markets Global
FXCM
KVB
AvaTrade
Exness
STARTRADER
IC Markets Global
FXCM
KVB
Tin HOT
Jerome Powell đối mặt truy tố hình sự, Fed và ông Obama vào tầm ngắm
 WikiFX
Fed sụp đổ, ai sẽ trả giá khi bức tường 112 năm không còn?
WikiFXTin tức Forex 21/07: Hội nghị đối tác của Exness, MH Markets niêm yết NASDAQ
WikiFXChiêu trò lừa đảo mới mang tên Remitano: Mạo danh lãnh đạo, gắn mác "Chính phủ bảo trợ"
WikiFXTop 5 sàn giao dịch Forex được tìm kiếm nhiều nhất tháng 06/2025
WikiFXUSD tăng, vàng giảm: Kịch bản tạm thời hay tín hiệu đảo chiều?
WikiFXWikiFX Review sàn Forex Doo Prime 2025: Bí mật là gì? Có đáng tin cậy không?
WikiFX5 loại chi phí giao dịch Forex và bí quyết tối ưu dành cho người mới
WikiFXLàm giàu 4.0 và sự thật trần trụi sau những "cú lừa tiền ảo" triệu đô
WikiFX3 Bài học đắt giá từ vụ án sàn giả mạo ATFX bị triệt phá tại vùng Tam Giác Vàng
WikiFXTính tỷ giá hối đoái

